This feature is only available for Lightspeed Retail merchants on select pricing packages.
Sales by Category Report
Analyze the sales performance of item categories with the Sales by Category report. See which categories generate the most sales/returns, which have the highest costs, and which are most profitable.
Visit our Organize Inventory article to learn how categories are used and how to assign items to them.
Run the Report
From BackOffice, run the Sales by Category report for an overview of sales activity across all categories during a specific time period.
- In BackOffice, click 'Reports' and select 'Categories'.

- Click the Date icon to choose a preset or custom range, then click 'Retrieve'.

- (Optional) Click the drop-down to select whether to run the report for the current location only or for all linked locations.
This setting is available to merchants with multiple linked locations and is only visible to the Business Owner. Visit our New Store Setup article to learn how to create a new linked location or our Multi-Store Management guide to learn how to link existing locations.

Read the Report
The Sales by Category report shows which types of stock items are in demand and which are not. Learn to read this report and master its data to make more informed business decisions.
Bar Charts
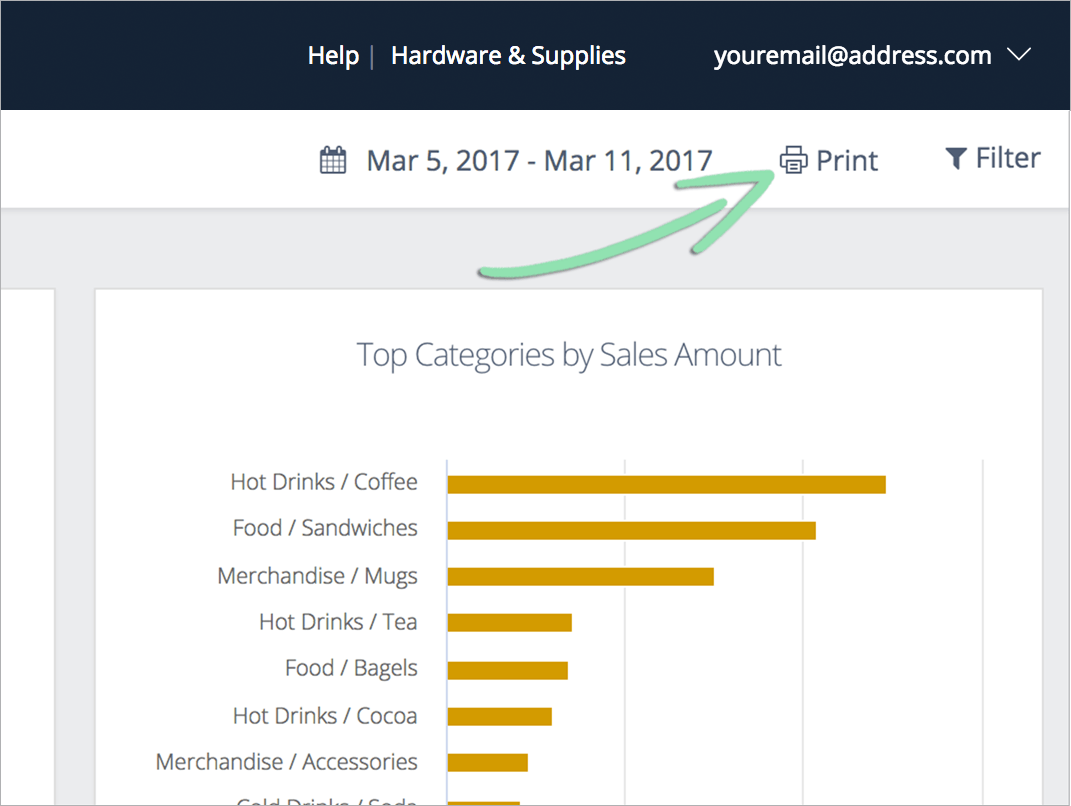
The charts show top categories by quantity of items sold & by sales amount for the selected date range.
Sales are attributed to categories based on the category assigned to each item at the time it was originally sold.
The term Other is a combination of all categories outside the top 10.
- Hover over or tap on a bar to see the quantity/amount and percent of total for that category.
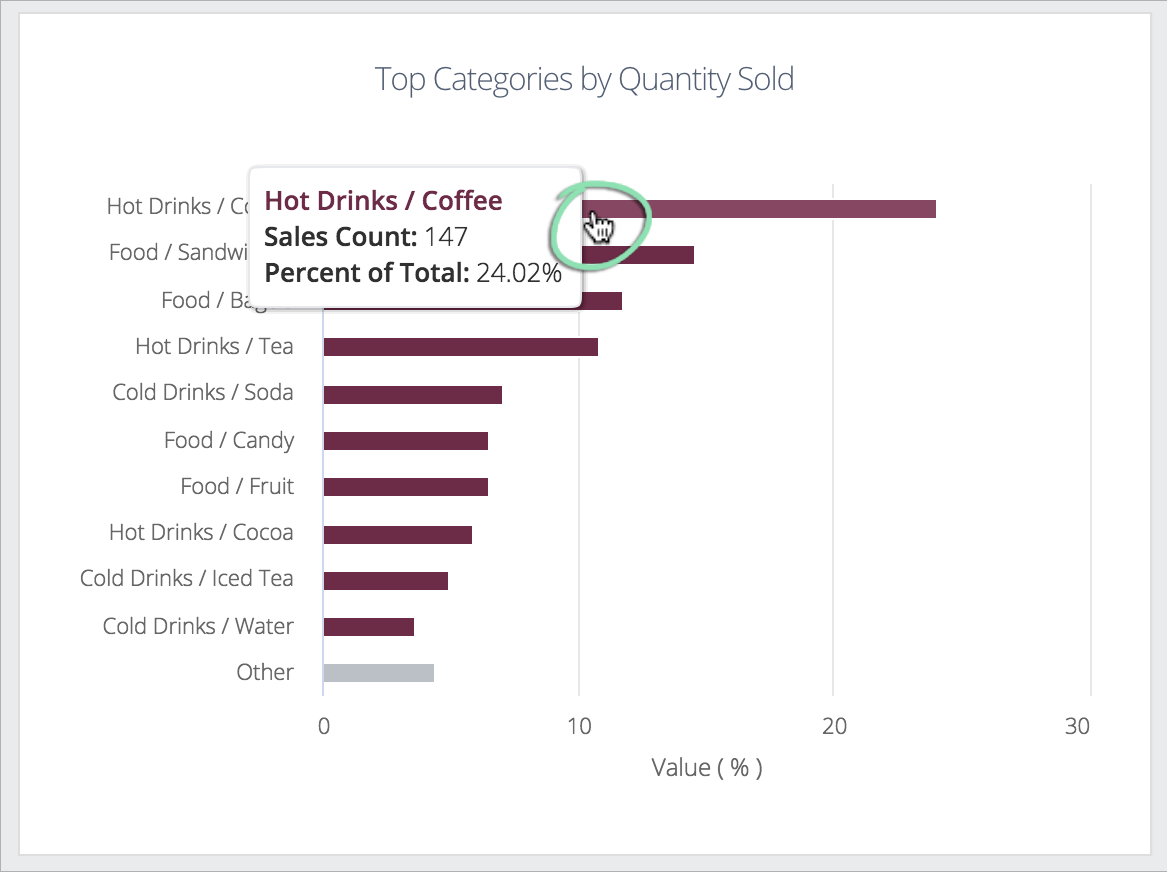
Table View
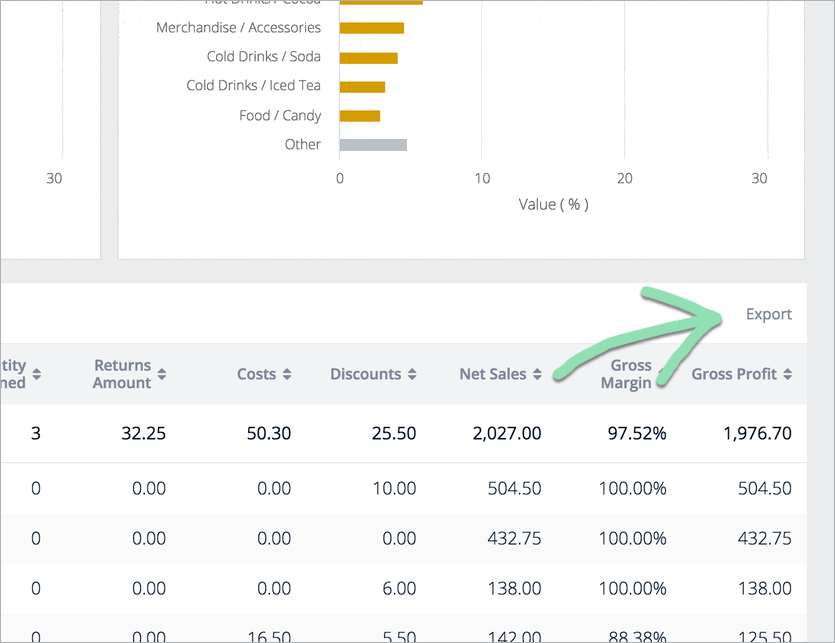
The table provides detailed information about all categories with sales activity over the selected date range.
Sales and returns are attributed to categories based on the category assigned to each item at the time it was originally sold.
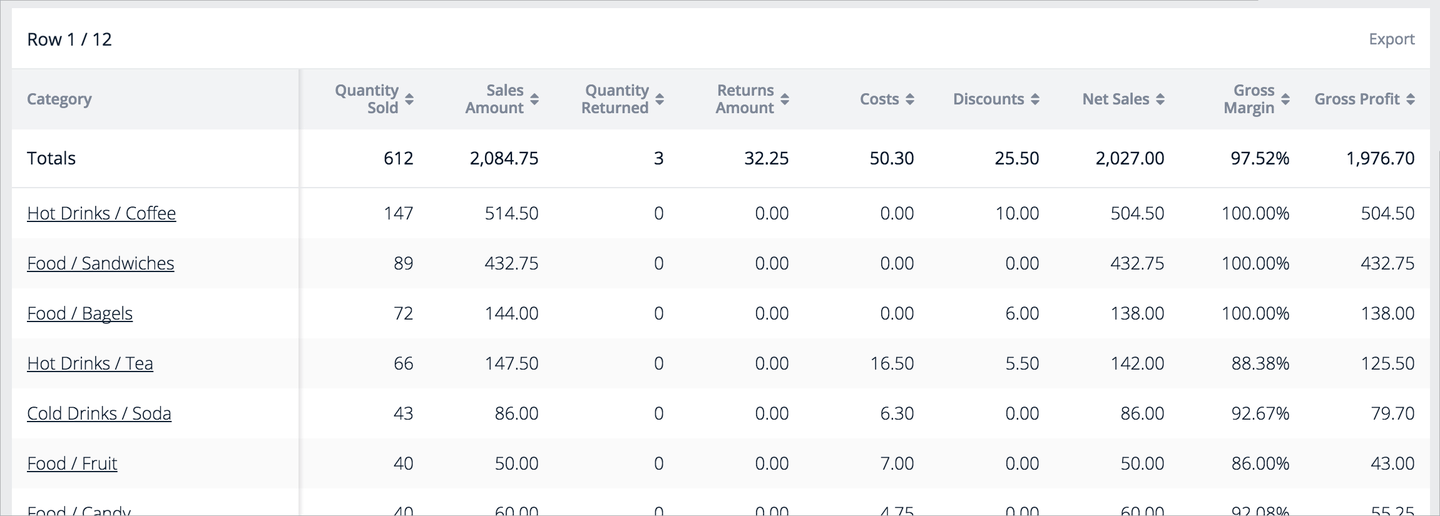
The following table columns display by default:
Category | Name of the category.
Quantity Sold | Total quantity of items from the category that were sold.
Sales Amount | Total sales amount before discounts, returns, gratuity, and tax.
Costs | The business cost of items sold minus the cost of items returned.
By default, Cost is calculated using the weighted average cost at the time of sale for each item.
To use last cost, follow the steps here to disable the weighted average cost feature.
Discounts | Discounts on sold items minus discounts on returns.
Want more detail on discount usage? Check out the Sales by Discount report.
Net Sales | Sales Amount, minus Returns Amount, and minus Discounts.
Gross Margin | Percentage of Net Sales left after accounting for cost.
Gross Profit | Net Sales minus Costs.
Returns Amount | Total returns amount before discounts, gratuity, and tax.
- Click any header with arrows to sort the table ascending/descending.
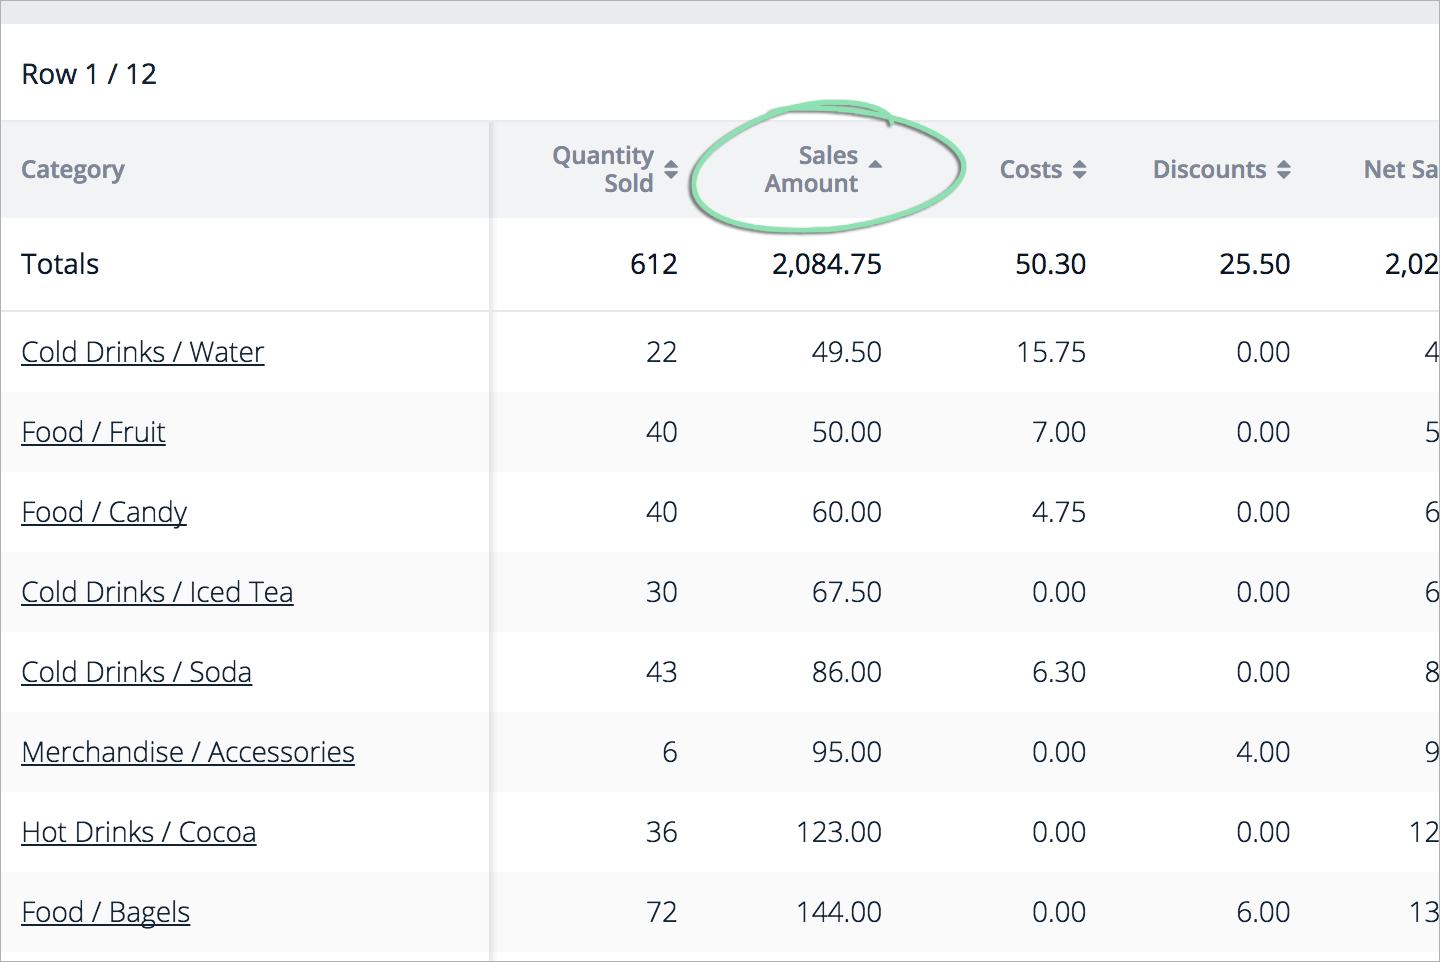
- Click any row to view the sold and returned items for a category.
- This feature is only available when running the report for a single location. Visit the Run the Report section to learn how to toggle between running the report for a single location or all linked locations.
- Items appear with the names currently entered in BackOffice for them.

Check out the related Sales by Department report next. Visit the Sales by Department article to learn how to access and read this report.
Filter the Report
Filter the report by category to hide categories you don’t want to see or to display only specific categories. Filter by column to customize which table columns appear on the report.
- Click 'Filter'.

- To hide a category, uncheck its box.
- To show the category again, re-check the box.
- Use the filter controls to search for a category, select all categories, and clear all selections.
Category filters apply to the Bar Charts, Table View, Export, and Print View.

- To show a table column, click 'Show/Hide Columns' and check its box.
- To hide a column, uncheck the box.
Column filters apply to the Table View and Print View.

Export the Report
Download a copy of the Sales by Category report to analyze and filter its data using spreadsheet software.
- On the Table View, click 'Export'.
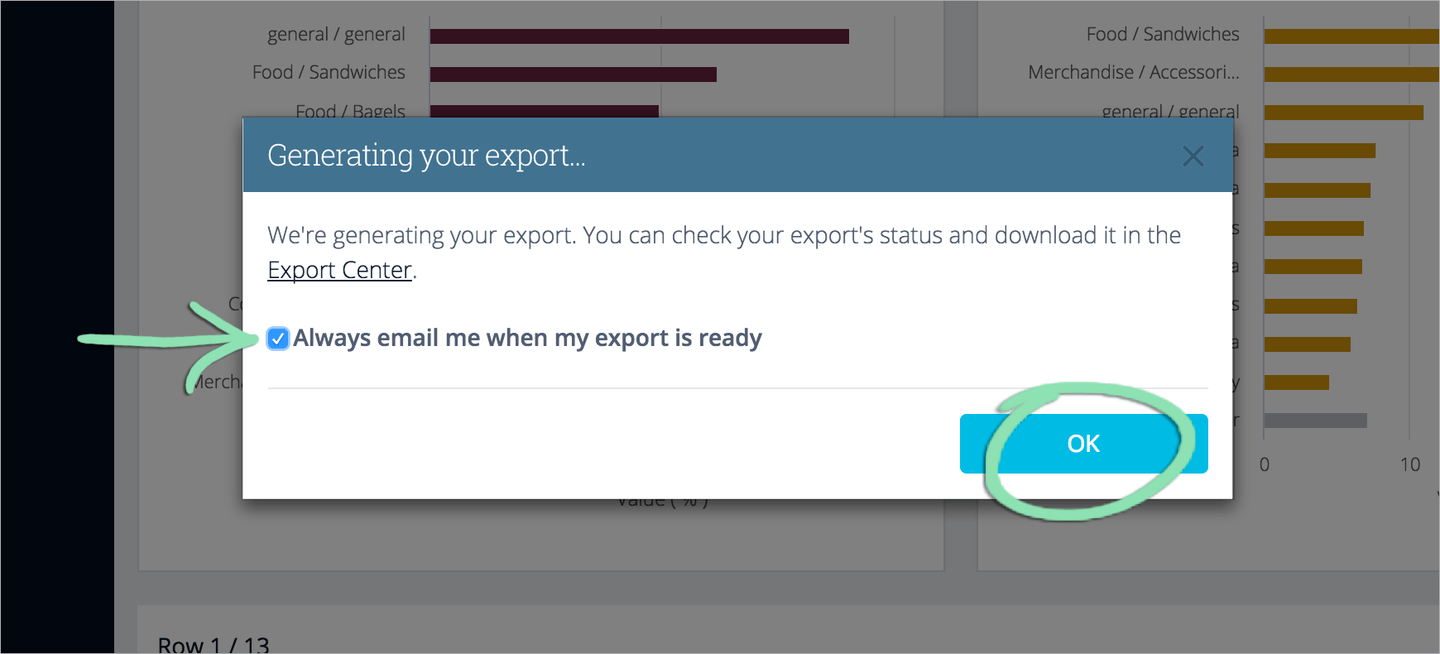
- Wait for the export to be generated. Check the box to be notified by email when exports are ready for download (optional).
Exports ready in a few seconds will automatically download. Click ‘Close’ to close the message box.

Exports that take more than a few seconds to generate are downloadable via the Export Center when ready. Click ‘OK’ to close the message box.
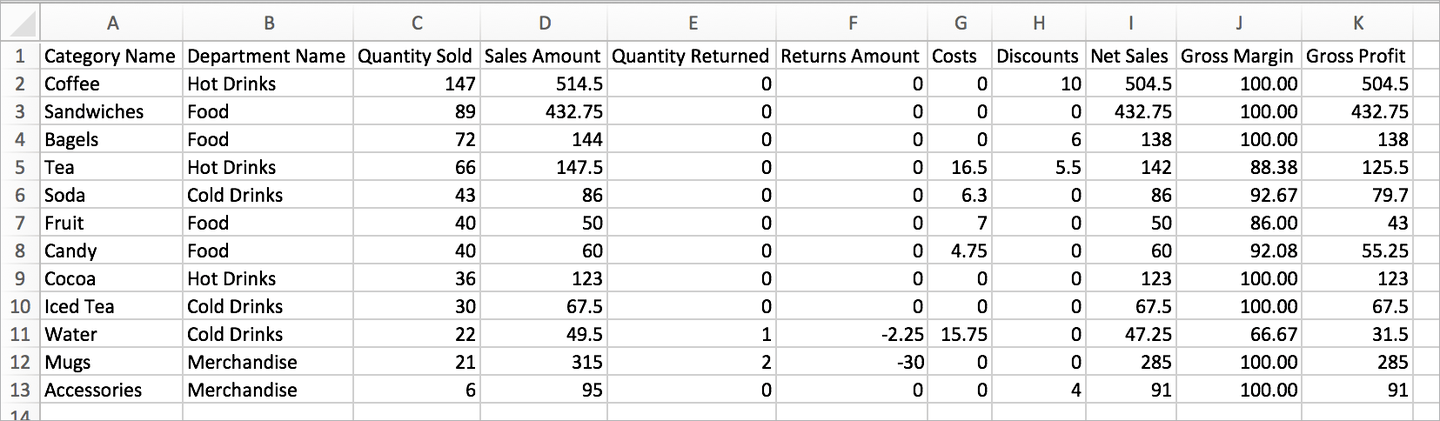
- After downloading, the export is ready to open in any spreadsheet software.
Print the Report
Use the Print feature to generate the report in a printer-friendly format that can be printed or saved.
- Click 'Print'.
- Wait for the report to open in a new browser tab.

- Click 'File' on the web browser’s menu and select 'Print'.
Or, save the print view as a PDF for easy sharing.
