This feature is only available for Lightspeed Retail merchants on select pricing packages.
Sales by Supplier
Use the Sales by Supplier report to track how products from each supplier are performing. Compare inventory costs across suppliers to better understand which supplier’s items are most and least profitable.
Visit our Add Basic Items article to learn how to attach suppliers to items when setting up inventory.
Run the Report
From BackOffice, run the Sales by Supplier report for an overview of total item sales from a supplier during a specified date range.
- In BackOffice, click 'Reports' and select 'Suppliers'.

- Choose a preset or custom date range, and click 'Retrieve'.

- (Optional) Click the drop-down to select whether to run the report for the current location only or for all linked locations.
This setting is available to merchants with linked locations and is only visible to the Business Owner. Visit our New Store Setup article to learn how to create a new linked location or our Multi-Store Management guide to learn how to link existing locations.

Read the Report
Follow along below to learn how to fully understand the report to take advantage of all the benefits it has to offer your business.
Bar Charts
These charts show your Top 10 suppliers by item quantity sold and total sales amount.
Sales are attributed to suppliers based on the supplier assigned to each item at the time it was originally sold. Suppliers appear with the names currently entered in BackOffice for them.

Hover over or click a bar on the graph to see more details about the supplier.

Table View
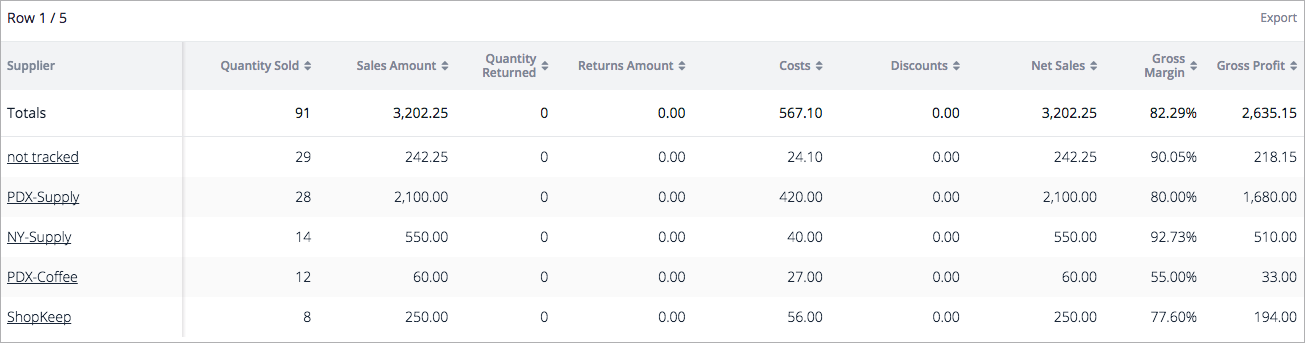
The table view provides detailed information about all suppliers with sales activity over the selected date range. By default, only the first 4 columns display on the Table View. To enable all the columns seen below, use the Filter control.
Sales and returns are attributed to suppliers based on the supplier assigned to each item when it was originally sold.
Default Table View
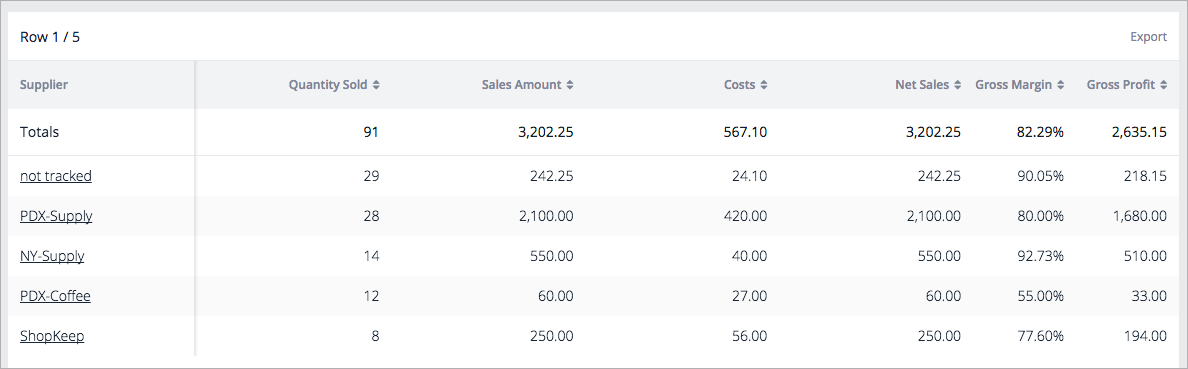
Table View with All Columns
* Sort the table by clicking any column header with arrows.
Supplier Name | Name of the supplier as it is currently entered in BackOffice.
Quantity Sold | The total number of items sold from the supplier.
Sales Amount | The total amount of an item sold.
Quantity Returned | The total number of items returned.
Returns Amount | The total amount of items returned.
Costs | The total costs spent on the sold items. Net of returns for the supplier.
Discounts | The total amount discounted on items sold. Net of returns for the supplier. Visit the Sales by Discount article to view more detailed reporting on discounts.
Net Sales | The revenue generated by sales after accounting for returns and discounts.
Gross Margin | The percent of revenue that remains after accounting for costs and discounts. Net Sales minus Cost of Goods Sold (COGS), divided by Net Sales.
Gross Profit | The amount of revenue that remains after accounting for costs and discounts. Net Sales minus Cost of Goods Sold (COGS).
Filter the Report
Filter the report by column to customize which table columns appear on the report. Filter the report by supplier to hide suppliers you don’t want to see or to display only specific suppliers.
Filter Columns
Columns determine the data displayed in the report’s Table and Print Views. Note that the Quantity Returned, Returns Amount, and Discounts columns are hidden by default.
- Click 'Filter'.

- Click 'Show/Hide Columns' and check/uncheck the boxes.

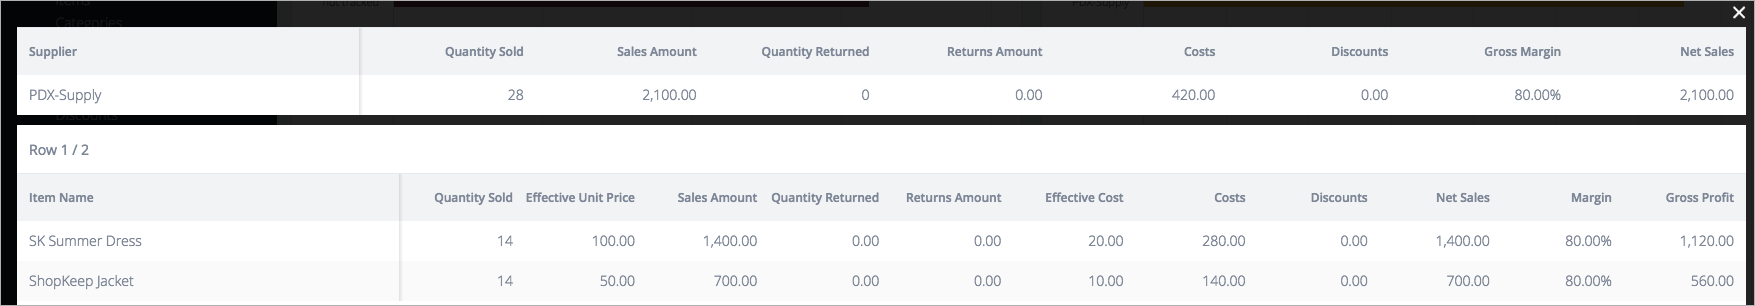
- On the table, click any row to view more details about the sold items from that supplier.
Filter Suppliers
Filter by supplier to hide suppliers you don’t want to see on the report. Supplier filters apply to the Table View, Bar Charts, Export, and Print View.
- Click 'Filter', then 'Suppliers'. Check/uncheck the boxes.

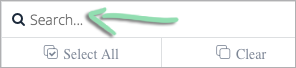
- (Optional) Use the filter controls to search for a supplier, select all suppliers, and clear all selections.
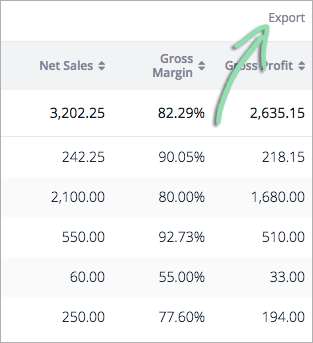
Export the Report
Download a copy of the report to further analyze and filter the data using spreadsheet software.
- On the Table View, click 'Export'.
- Wait for the export to be generated, then check the box to be notified by email when exports are ready for download if you'd like.
Exports that are ready within a few seconds will automatically download to your computer. Click ‘Close’ to exit the message box. Exports that take more than a few seconds to generate are downloadable via the Export Center when ready. Click ‘OK’ to close the message box.

- After downloading, the export is ready to open in any spreadsheet software.
All columns on the export are the same as the Table View columns defined above.
Print the Report
Use the Print feature to create the report in an easy-to-read and printer-friendly format.
- Click 'Print'.

- Wait for the report to open in a new browser tab.

- Select 'File' from your browser's menu and choose 'Print...'.
You can also choose to save the report as a PDF for easy sharing.
