This feature is only available for Lightspeed Retail merchants on select pricing packages.
Sales by Customer Report
Use the Sales by Customer report to view the business’s top customers, see what they purchased, and check who has visited lately.
Check out our Manage Customers article for help adding customers to the Customer List.
Run the Report
From BackOffice, run the Sales by Customer report for an overview of what each customer has purchased during a specific time period.
- In BackOffice, click 'Reports' and select 'Customers'.
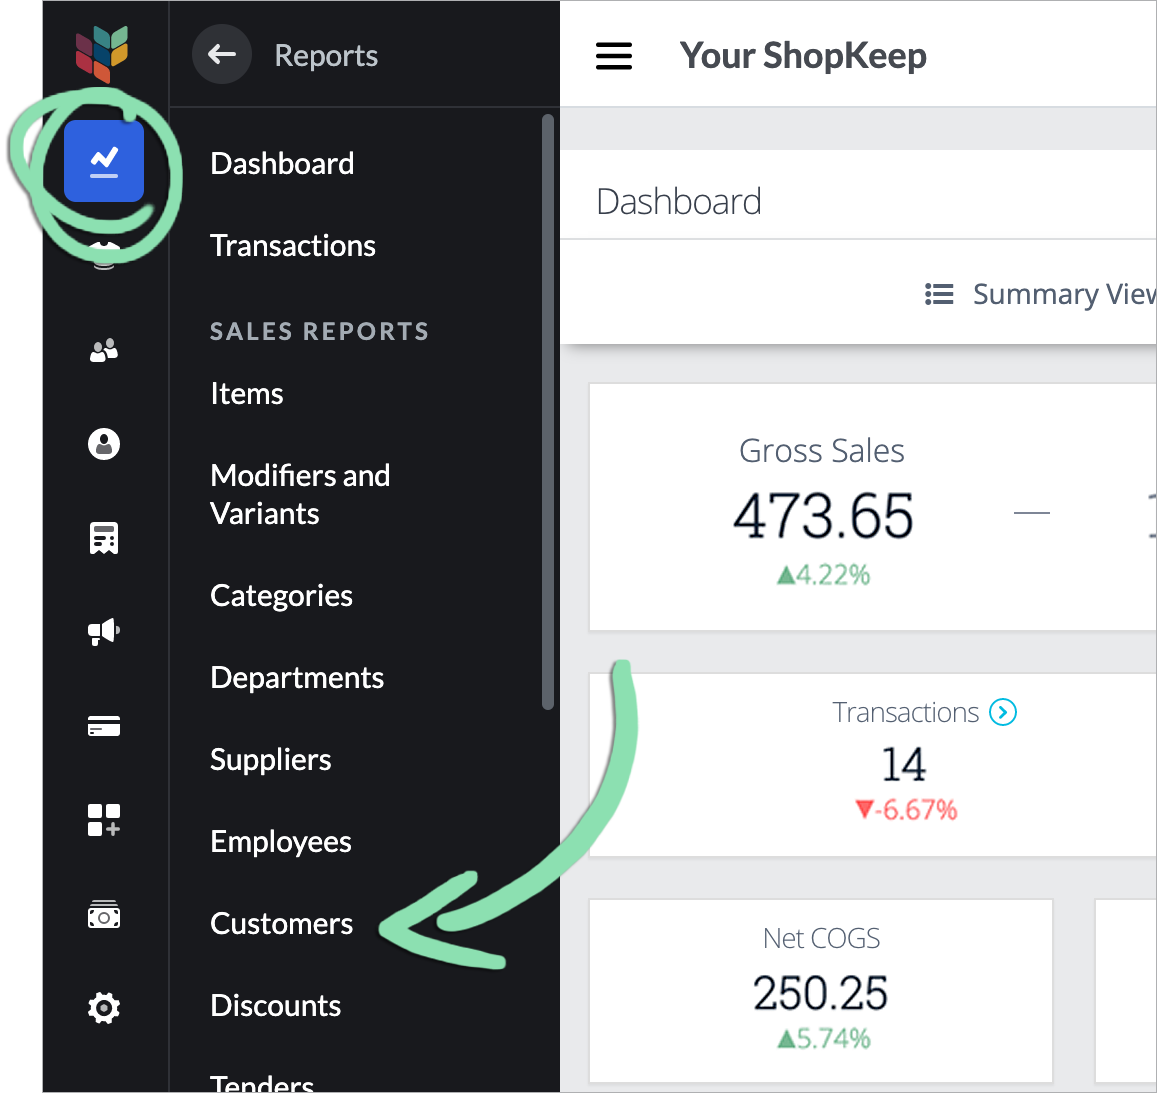
- Click the Date icon to choose a preset or custom range, then click 'Retrieve'.

Read the Report
The Sales by Customer report shows which customers stop by most often and who spends the most money. Learn to read this report to understand its data and discover new insights about the business.
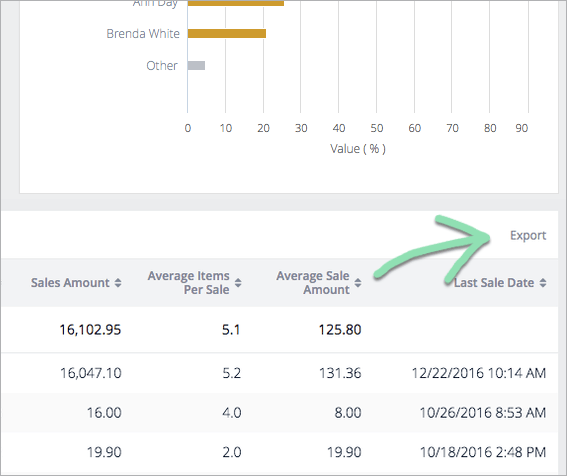
Bar Charts
The charts at the top show top customers by their number of sales and total sales amount.
Customers appear with the names currently entered in BackOffice for them.

- Hover over or tap on a bar to see the quantity/amount and percent of total for that customer.

Table View
The table provides detailed information about all customers with sales activity over the selected date range.
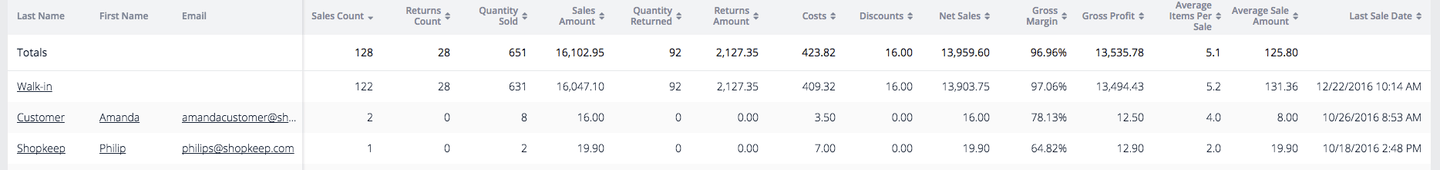
The following table columns display by default:
Sales Count | Number of sale transactions by the customer.
Quantity Sold | Total count of items purchased by the customer.
Sales Amount | Total dollar amount of items purchased by the customer.
Average Items Per Sale | Quantity Sold divided by Sales Count.
Average Sale Amount | Sales Amount divided by Sales Count.
Last Sale Date | Date and time of the customer’s last transaction.
Quantity Returned | Total number of items returned by the customer.
Returns Amount | Total dollar amount of items returned by the customer.
Costs | Total business cost of items sold minus the cost of returned items.
By default, Cost is calculated using the weighted average cost of each item at the time of sale.
To use last cost, follow the steps here to disable the weighted average cost feature.
Discounts | Discounts on sold items minus discounts on returns.
Want more detail on discount usage? Check out the Sales by Discount Report.
Net Sales | Sales Amount, minus Returns Amount, and minus Discounts.
Gross Margin | Percentage of revenue left after accounting for cost and discounts. Calculated by subtracting Cost from Net Sales, then dividing the result by Net Sales.
Gross Profit | Total business profit after subtracting Cost from Net Sales.
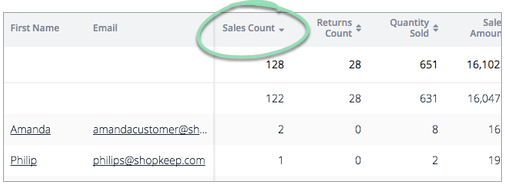
- Click any header with arrows to sort the table ascending/descending.
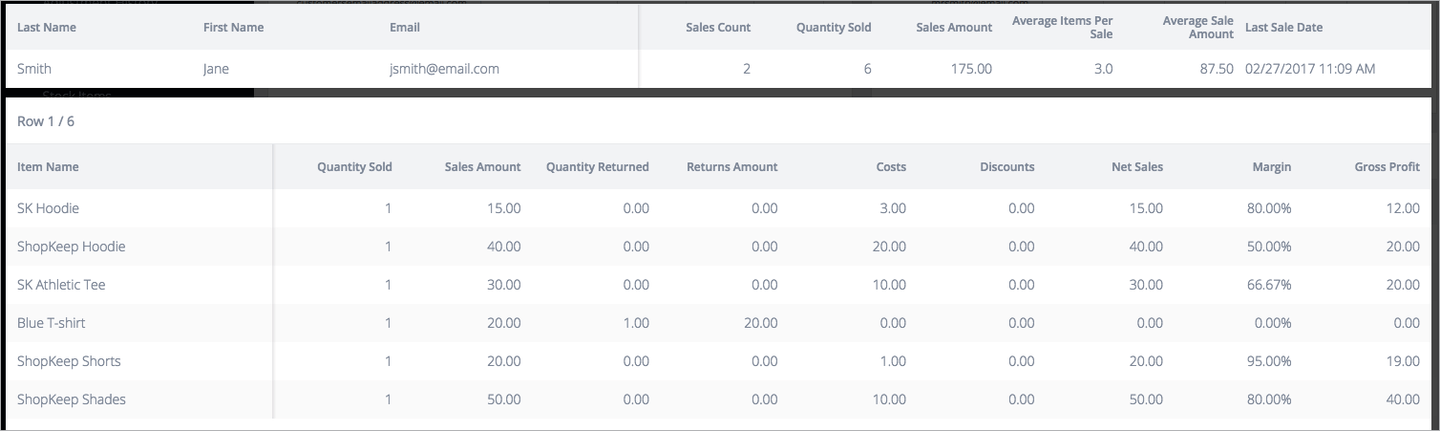
- Click any table row to view the specific items a customer purchased.
Items appear with the names currently entered in BackOffice for them.
Filter the Report
Filter the report by customer to hide customers you don’t want to see or to display only specific customers. Filter by column to customize which table columns appear on the report.
- Click 'Filter'.

- To hide a customer, uncheck their box.
- To show the customer again, re-check the box.
- Use the filter controls to search for a customer, select all customers, and clear all selections.
Customer filters apply to the Bar Charts, Table View, Export, and Print View.

- To show a table column, click 'Show/Hide Columns' and check its box.
- To hide a column, uncheck the box.
Column filters apply to the Table View and Print View.

Export the Report
Download a copy of the Sales by Customer report to analyze and filter its data using spreadsheet software.
- On the Table View, click 'Export'.
- Wait for the export to be generated. Check the box to be notified by email when exports are ready for download (optional).
Exports ready in a few seconds will automatically download. Click ‘Close’ to close the message box.

Exports that take more than a few seconds to generate are downloadable via the Export Center when ready. Click ‘OK’ to close the message box.

- After downloading, the export is ready to open in any spreadsheet software.
 Most columns are the same as the Table View columns defined above, but there is one extra:
- Customer ID | Used to link a customer’s sales with the information on the Customers Export.
Print the Report
Use the Print feature to create the report in a printer-friendly format that can be printed or saved.
- Click ‘Print’.

- Wait for the report to open in a new browser tab.

- Click 'File' on the web browser’s menu and select 'Print'.
Or, save the print view as a PDF for easy sharing.
