This feature is only available for Lightspeed Retail merchants on select pricing packages.
Sales by Employee
Use the Sales by Employee report to analyze employee sales performance. See who generates the most sales and returns, who has the highest average sale value, and who rakes in the most tips. This report’s data can help you visualize staff productivity, figure out commissions, and plan shift schedules.
Visit our Manage Staff article to learn how to add, edit, and delete employees.
Run the Report
From BackOffice, run the Sales by Employee report for an overview of employee sales performance during a specific time period.
- In BackOffice, click 'Reports' and select 'Employees'.

- Click the date icon to choose a preset or custom range, then click 'Retrieve'.

Read the Report
Learn to read the Sales by Employee report to understand employee sales performance and identify the business’s top performers.
Bar Charts
The charts show top employees by number of sales and by sales amount for the selected date range.
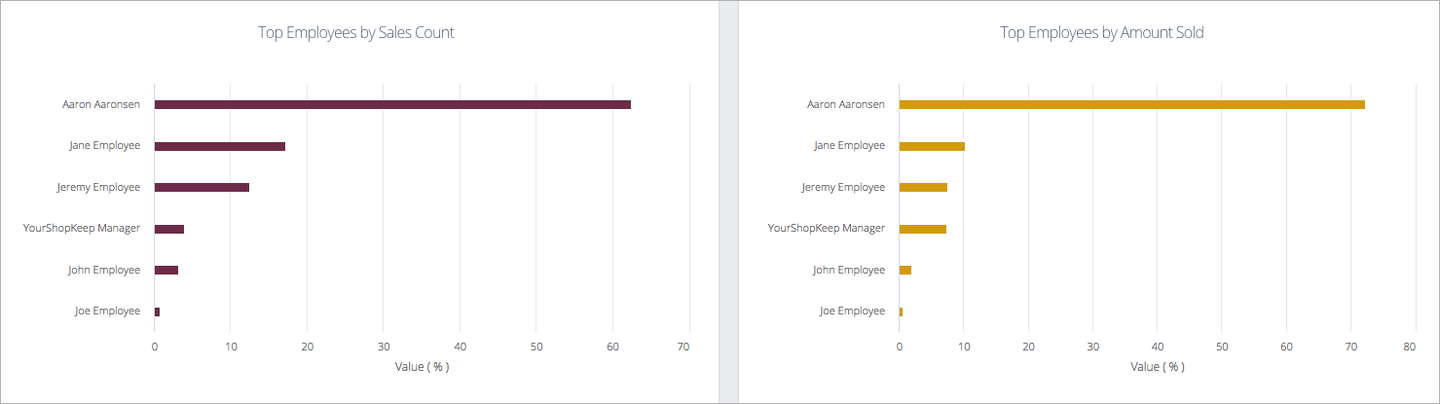
- Hover over or tap on a bar to see the count/amount and percent of total for that employee.

Table View
The table view provides detailed information about all employees with register activity during the selected date range. The first row, Totals, gives the total value for each column.
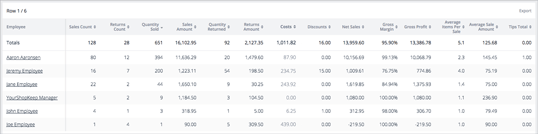
The following table columns display by default:
Employee | Name of the employee as it is currently entered in BackOffice. Supported Lightspeed eCom (E) orders marked ‘Paid’ in the eCommerce Dashboard will not appear on this report. Sales run in Lightspeed Pocket will appear in reporting as being performed by the Business Owner. If invoice reporting is enabled, paid invoices will appear as being performed by the employee who originally printed or emailed each invoice.
Sales Count | Total number of sales processed by the employee.
Quantity Sold | Total quantity of items sold.
Sales Amount | Total sales amount before discounts, returns, gratuity, and tax.
Discounts | Discounts on sales minus discounts on returns.
Want more detail on discount usage? Check out the Sales by Discount report.
Net Sales | Sales Amount, minus Returns Amount, and minus Discounts.
Average Items Per Sale | Each employee’s average quantity of items sold per transaction.
Average Sale Amount | The average sales (sales amount – discounts) amount per sale transaction.
Tips Total | The total amount of non-cash gratuity accrued by the employee at the register, including tips from Lightspeed eCom (E) orders* closed at the register by the employee.
*Excludes tips left on orders not paid online by credit card (e.g. cash orders) that are placed while eCommerce online ordering is enabled. To learn more about how tips for online orders appear in reporting, visit our eCommerce Advanced Topics article.
To learn how to accept and pay out tips at the register, visit our Tips and Gratuity article.
Returns Count | Total number of return transactions.
Quantity Returned | Total quantity of items returned.
Returns Amount | Total returns amount before discounts, gratuity, and tax.
Costs | The business cost of items sold minus the cost of items returned.
By default, Cost is calculated using the weighted average cost at the time of sale for each item.
Gross Margin | Percentage of Net Sales left after accounting for cost.
Gross Profit | Net Sales minus Costs.
- Click any header with arrows to sort the table.

- Click any table row to see the specific items an employee sold.
Items appear with the names currently entered in BackOffice for them.

Filter the Report
Filter the report by employee to hide employees you don’t want to see or to display only specific employees. Filter by column to customize which table columns appear on the report.
- Click 'Filter'.

- To hide an employee, uncheck their box.
- To show the employee again, re-check the box.
- Use the filter controls to search for an employee, select all employees, and clear all selections.
Employee filters apply to the Bar Charts, Table View, Export, and Print View.

- To show a table column, click 'Show/Hide Columns' and check its box.
- To hide a column, uncheck the box.
Column filters apply to the Table View and Print View.

Export the Report
Download a copy of the Sales by Employee report to analyze and filter its data using spreadsheet software.
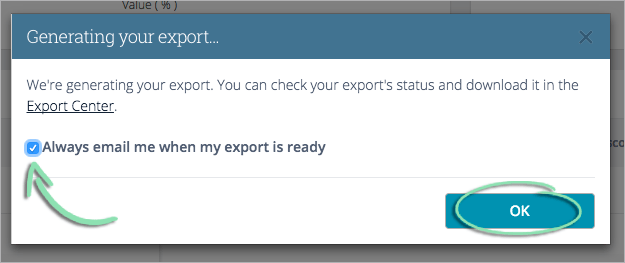
- On the Table View, click 'Export'.

- Wait for the export to be generated. Check the box to be notified by email when exports are ready for download (optional).
Exports ready in a few seconds will automatically download. Click ‘Close’ to close the message box.

Exports taking more than a few seconds to generate are downloadable via the Export Center when ready. Click ‘OK’ to close the message box.
- After downloading, the export is ready to open in any spreadsheet software.

Print the Report
Use the Print feature to create the report in an easy-to-read and printer-friendly format.
- Click 'Print'.

- Wait for the report to open in a new browser tab.

- Click 'File' on the web browser's menu and select 'Print'.
Or, save the print view as a PDF for easy sharing.
