Exciting Reporting Improvements, Including Sales by Discount
Enjoy simpler navigation along with detailed access to your sales data.
As you may remember, this past September we launched a new reporting infrastructure designed to provide you with accurate, easy to use, and flexible reporting. Since then we’ve been working hard on both improvements and additions to this new reporting, listening to your feedback throughout the process. Today we’re happy to tell you about some of the key changes we’ve made, along with announcing an entirely new report: Sales by Discount!
Name Change: Goodbye Sales by Variable, Hello Sales Reports
One of our ongoing objectives is to make the work you do within ShopKeep easy and intuitive. As we were originally designing the updates to the Sales by Item and Sales by Department reports, we realized that they shared a lot of traits in common. Both reports allow you to see various metrics aggregated by a dimension (Items or Departments) over a period of time. And since we have many more reports planned that follow a similar pattern, we figured the easiest way for you to access them was to put them all on a single page that had a control to change which dimension (or variable) you were analyzing. We named this new report Sales by Variable.

Fast forward a few weeks after the launch, and we quickly discovered that the name was wholly inadequate; Sales by Variable was not at all an intuitive place to go and find the Sales by Department or Sales by Item reports. With the release of Sales by Discount, we’ve taken the step of changing the name of this section of reports to something that we believe is more accurate, intuitive, and attention-grabbing: Sales Reports.
We hope that new and veteran BackOffice users alike will find be more excited to click on it and have a look at what’s inside. Speaking of which…
Sales Reports: Simple Interface, Many Options (and growing!)
When you navigate to the Sales Reports page, you’ll start with Sales by Department. On this page, you will see two charts at the top showing your top departments by items sold and by total dollar amount, along with a data table below providing you with key metrics about each department line-by-line.
In the top left of the page, you will see a dropdown that lets you switch among Sales by Department, Sales by Item, and now Sales by Discount. We have several more reports planned, including Sales by Customer and Sales by Tender, so keep an eye out for notifications when new reports are available.
On the upper right, you’ll find a Filter button. The panel that slides out will enable you to hide and show columns and filter rows in the table, allowing you to refine what you’re analyzing so you only see what’s most important to you. Additionally, at any time, you can click the Print button to create a printer-friendly view of your report that can be printed or shared with colleagues and other business stakeholders. This print view also provides totals across all the metrics in the data table, something that we will be adding to the web view of the reports soon as well.
Finally, for the Sales by Item and Discount reports, there is an Export button that will create an export for you of all the data currently in your data table. The Sales by Item report not only provides a basic item export, but also offers exports that include detailed information about your items with modifiers and with variants.
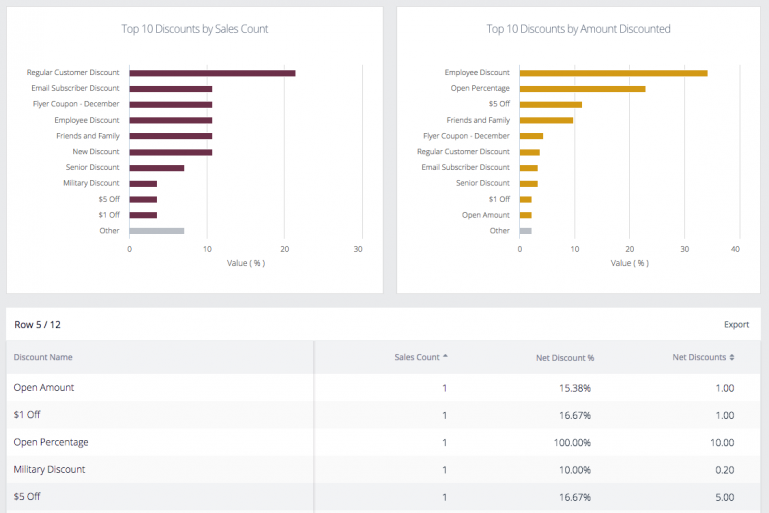
Sales by Discount and What’s Up Next
For those of you who use named discounts with ShopKeep, the new Sales by Discount report will be a very welcome addition to your BackOffice! This report looks just like the other sales reports, but in this case it shows you the overall usage of each of your named discounts, including the number of times the discount was used and the total amount discounted across those uses.
This post has had a ton of info to review, but we want to stress how important these changes are, both to immediately improve your reporting experience and to set the stage for future enhancements. In that vein, next up we’ll be adding a Sales by Customer report that will allow you to see all of your customers’ purchases, quickly identify which of your customers are most valuable, and even see who hasn’t visited in awhile.
That’s it for now, but we would love to hear your feedback on any or all of these updates. Happy reporting!

Want to try ShopKeep for yourself?
Just answer a few easy questions.
Need help finding the right point of sale?
Just complete the form. We’ll call you right back to explain how ShopKeep can work for you.
Hit the ground running.Sprinting, in fact!
Read our free, comprehensive guide, Small Business 101, to learn all you need to know about starting a thriving business.