
Everything You Need to Know About In-Store Retail Analytics
Life can be tough for small business retailers. There are a million things to do and never enough time to do them all.
Sometimes (heck, who are we kidding, most times) it can be hard to know where to focus your time and energy. That’s where in-store retail analytics solutions come in.
This advanced technology is designed to give retailers like you the data that you need to understand the inner workings of your business, so you can put your effort into the projects and tasks that improve the customer experience, keep shoppers coming back for more, and help you run your store more efficiently.
Better yet, what if you could take all of that data with you in the palm of your hand? You wouldn’t need to be in your store to run your store. How’s that for game-changing?
What Are In-Store Retail Analytics?
We’ll get into the idea of mobile retail analytics later on in the post; let’s first start with a basic explanation of in-store retail analytics, so we’re all on the same page. According to Wikipedia, analytics is defined as, “the discovery, interpretation, and communication of meaningful patterns in data.”
In-store retail analytics simply takes this collection of processes and applies them to retail store operations. In doing so, retailers can get more insight into the performance of their business on both micro and macro scales.
It sounds complicated, but in practical terms, it isn’t. Vendors who sell small business software products that include an analytics component know that most retailers aren’t technology experts or mathematicians and analysts by trade. You need data-driven insights that are easy to understand and quickly applicable.
To achieve this goal, their retail business analytics solutions usually includes pre-built reports that spit out the key metrics you need, when you need them. For typical retailers, this might mean campaign performance reports from your email marketing campaigns or a profit and loss breakdown from your accounting solution. With either report, you can make some pretty significant decisions about your overall business strategy that are rooted in cold hard facts, not guesswork.
Why Use In-Store Retail Analytics?
As we just touched on, one of the biggest reasons to use analytics to guide decision making is that your decisions then become based on the truth vs. your perception of reality.
No matter how objective we try to be in a situation, humans are riddled with cognitive biases. We also tend to see and act on patterns and correlations that are fundamentally flawed. What follows is an example of how that might play out in a retail setting.
You hire a new employee. Shortly after that, you notice that products go missing from shelves and it isn’t reflected in your sales numbers. You have a loss prevention problem. You immediately suspect the new hire, because the problem began shortly after they started. However, you bring up the issue to your team, and a store manager confesses to the thefts.
In the above scenario, you almost made a horrible mistake because you were about to act on what is best called a spurious relationship. With analytics in place, you might have noticed that the thefts began long before you hired your new employee, thus eliminating them as a suspect. Insights like this demonstrate the power of analytics. They help you get to the truth and reduce errors through the elimination of guesswork or gut instinct.
Analytics also help you understand what’s going on with your business in much greater detail than you could otherwise. Here are a few examples of other insights that analytics can uncover:
- Understand the value and number of products sold in an average order
- Figure out which products sell the most, the least, and everything in-between
- Track sales by the hour to understand your in-store conversion rates
- Customer analytics can help you identify your most valuable customers
- Find your top and least selling employees
Armed with these insights, you can better understand the metrics of your business and implement strategies that help you get to where you want to go faster than you could otherwise. Staff your best salespeople during your peak sales hours to drive more revenue. Implement a new up-sell display at checkout to increase your average order value. Improve cash flow by stocking more of the products that sell the best and fewer of the ones that sell the least. Institute a customer loyalty program to enhance your customer retention and customer satisfaction efforts. Better target your email campaigns to market the right products to the right customers at the right time.
SEE ALSO: How to Measure Retail Sales Performance: The Fundamentals
How Do You Get Access to In-Store Retail Analytics?
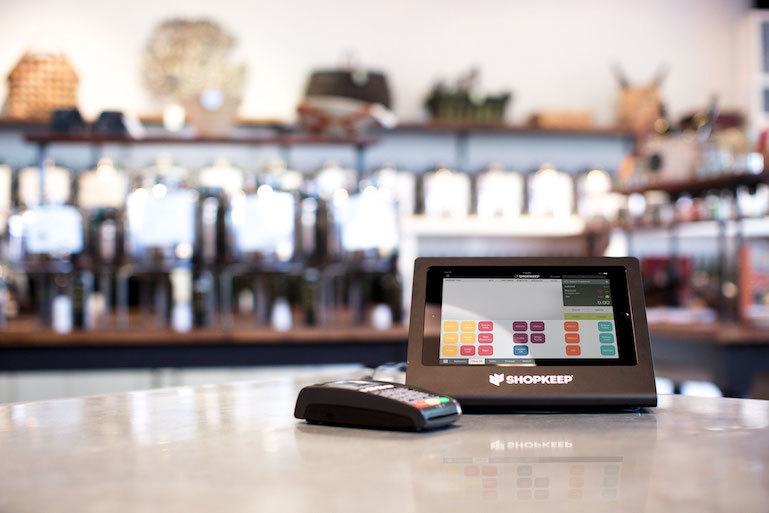
The best (and easiest) way to get access to retail analytics is with a point of sale (POS) system. Because these systems serve as the hub of a retail business, almost all business processes flow through them. This allows these systems to collect tons of valuable data. Savvy vendors have realized this and added robust reporting as a core feature of their systems.
In fact, I’d go so far as to say that outside of enhanced inventory management, access to analytics software is the main reason to choose a POS over a traditional cash register. So, when you’re looking at POS systems, make sure you evaluate the analytics capabilities of each to ensure they will meet the needs of your business.
Mobile Analytics Takes It One Step Further
The next big technology wave in analytics platforms that are taking the retail industry by storm is mobile. Think about your most used, and likely most valuable, possession. For most of you, we’re willing to bet that’s your smartphone. It’s probably fair to say that you have your phone with you at almost all times. It’s how you communicate with employees, post on your store social media profiles, and get navigation directions to your next supplier meeting. It only makes sense that you’d be able to access data about your retail store there too.
Some POS systems have already recognized the transformative impact of mobile retail analytics and are making this tool available to their retailers. Let’s look into why that matters.
The Value of Mobile Access to Analytics
Mobile access to retail analytics may seem like one of those “nice-to-have” vs. “must-have” capabilities. After all, if you have analytics in your POS system, do you really need to get them on your phone too? If your business is your full-time job, not a weekend hobby, then the answer is, “yes.”
It would be nice if you could sit in your store all day, helping customers and building relationships with your employees. But that’s not how retail works, especially if you’re running a multi-location business, or trying to maintain any semblance of a work-life balance. You need to get the job done where and when you can. Hence, the need for mobile analytics.
Mobile Analytics Save You Time
In the world of retailers, there’s never enough time. But with the right mobile apps – retail analytics included – you can make more time. According to a survey conducted by the Small Business and Entrepreneurship Council alongside AT&T, small business owners in the U.S. collectively save 599.5 million hours and $15.6 billion a year as a result of using mobile apps to help run their businesses.
It makes sense. If you have access to analytics on your phone, you don’t need to run back to your computer any time you want to look at data. You can check in on your business where and when you need to, just by opening an app on your phone. It doesn’t get much more convenient.
Similarly, what if you’re in a meeting with a supplier and need quick access to your inventory sales data, but you don’t have your computer? Instead of begging to borrow one, or making an educated guess about what exactly you need to reorder, you can just pull out your phone and get the exact data you need in real time.
Mobile Retail Analytics Give You More Freedom
When you’re CEO, head of human resources, chief marketer, salesperson extraordinaire, operations guru, and more, you can’t be chained down to a desk or sales counter. You need the freedom to move and work where the work is happening. Another scenario where mobile retail analytics is essential.
This is especially true if your business includes multiple stores. You need the freedom to check-in on each of your locations, without feeling like you’re sacrificing your ability to get work done. Mobile retail analytics allow you to look at critical in-store sales and inventory data no matter where you are, so you’re always in the loop and can make significant, informed decisions when needed.
Running a small business is tough, but running one while also trying to maintain a work-life balance, whether that’s with friends or family, can seem almost impossible. This is another scenario where mobile retail analytics can help. Want to look at sales volume for the last two hours while at your kid’s soccer game? With access to analytics data on your smartphone, you can do it in seconds without having to step foot in your brick and mortar store or office.
How Mobile Analytics Work, ShopKeep Style
At ShopKeep, we’ve long understood the value and competitive advantage offered by mobile access to analytics for retailers. After all, ShopKeep was founded by a small business owner just like you. We have offered ShopKeep Pocket, a standalone mobile retail analytics app since 2015.
We recently updated ShopKeep Pocket to give our customers an even better experience when accessing their critical business data on the go. Let’s look at the key data points that this app allows ShopKeep merchants to see and act on.
SEE ALSO: What A POS Report is and How it Can Boost Your Business
Sales Activity Data
This section of ShopKeep Pocket provides a bird’s eye view of your sales data and analytics for a given store location and date range. You can easily switch the date range, compare two date ranges against one another, and easily switch between stores if you run a multi-location business.
On this screen you can view metrics like:
- Gross Sales – Total sales before discounts, returns, gratuity, and tax. Sales of liabilities are not included here, but liability redemptions are.
- Net Sales – Gross sales minus discounts and returns.
- Sales Count – Total number of sales and returns performed at the register.
- Average Sale Value – Average value of each sale before tax (not including liabilities sold). This is gross sales minus discounts and divided by the number of sales.
- Returns – Amount refunded to customers before tax, gratuity, and discounts.
- Discounts – Total discounts on sales minus total discounts on return transactions.
- Net Cost of Goods Sold (COGS) – The business’ cost of items sold minus the cost of items returned.
- Gross Margin – Percentage of net sales left after accounting for COGS.
- Gratuity – Total amount of tips left on credit card transactions minus refunded gratuity.
- Sales Tax – Total tax amount charged on sales minus tax refunded on returns.
Net Sales Per Hour
This graph allows you to view net sales per hour for a given day to help you figure out your busiest and slowest times of the day so you can optimize your staffing. You can see this data by dollar amounts or by sales count (number of sales made), depending on which data point is more important to you. You can also compare this information across date ranges to identify trends in your business and compare data between all of your stores.
Tenders by Net Amount
This table provides you with a breakdown of sales by tender type for all registers within a location. It helps you identify the payment methods your shoppers prefer most, as well as the number of sales for each.
Top Items
Out of the box, this table shows you your top five most popular products by sales amount. You can also expand the list to view the full list of products sold for a given day so that you can make intelligent decisions about your merchandising mix. You can also sort the list by metrics other than sales amount for more insights:
- Sales Count – Total number of sale transactions.
- Net Sales – Sales revenue after subtractions for discounts and returns.
- Returns Amount – Total currency amount received from returns of asset items.
- Returns Count – Total number of return transactions.
- Costs – The of the cost of items sold, including both asset and liability items, not including raw goods. Also known as Cost of Goods Sold.
- Discounts – A deduction from the usual price of an item or transaction.
- Margin – The percentage of revenue that remains from each sale after accounting for costs and discounts.
Active Registers
This section gives you an overview of each of your registers for a store location. In addition to telling you who opened each register and when they opened it, the table gives you insight into the following information:
- Opening Cash – Opening drawer amount entered when the shift was opened.
- Drops/Pay-Ins/Payouts – Amount of cash added to or removed from the drawer due to pay-ins and payouts.
- Cash Tenders – Total amount of cash added to the drawer due to sales and returns during the shift.
- Expected Cash – Amount of cash expected to be in the drawer.
- Actual Cash – Closing drawer amount entered when the shift was closed. This is blank until the shift is closed.
- Over/Short – Difference between the expected cash and actual cash. This is blank until the shift is closed.
Please Note: This table appears only when ShopKeep Pocket’s date range is set to today. It cannot show you past register data.
Putting this valuable data in the palms of our customers’ hands is a key advantage that ShopKeep offers over many other mPOS systems. It empowers our merchants to do everything we’ve discussed in this article: manage their stores with greater freedom, flexibility, and accuracy than they could otherwise. If you want to check out ShopKeep Pocket, the first step is signing up for a demo of ShopKeep – the #1 rated iPad Point of Sale System.

Want to try ShopKeep for yourself?
Just answer a few easy questions.
Need help finding the right point of sale?
Just complete the form. We’ll call you right back to explain how ShopKeep can work for you.
Hit the ground running.Sprinting, in fact!
Read our free, comprehensive guide, Small Business 101, to learn all you need to know about starting a thriving business.