This feature is only available for Retail POS (S-Series) merchants on select pricing packages.
The Sales by Item report lets you track your sold items. You can see which items sell best, discover which are most profitable, and view other types of sales data on an item-by-item basis.
Running the report
From BackOffice, run the Sales by Item report for an overview of individual inventory item sales.
-
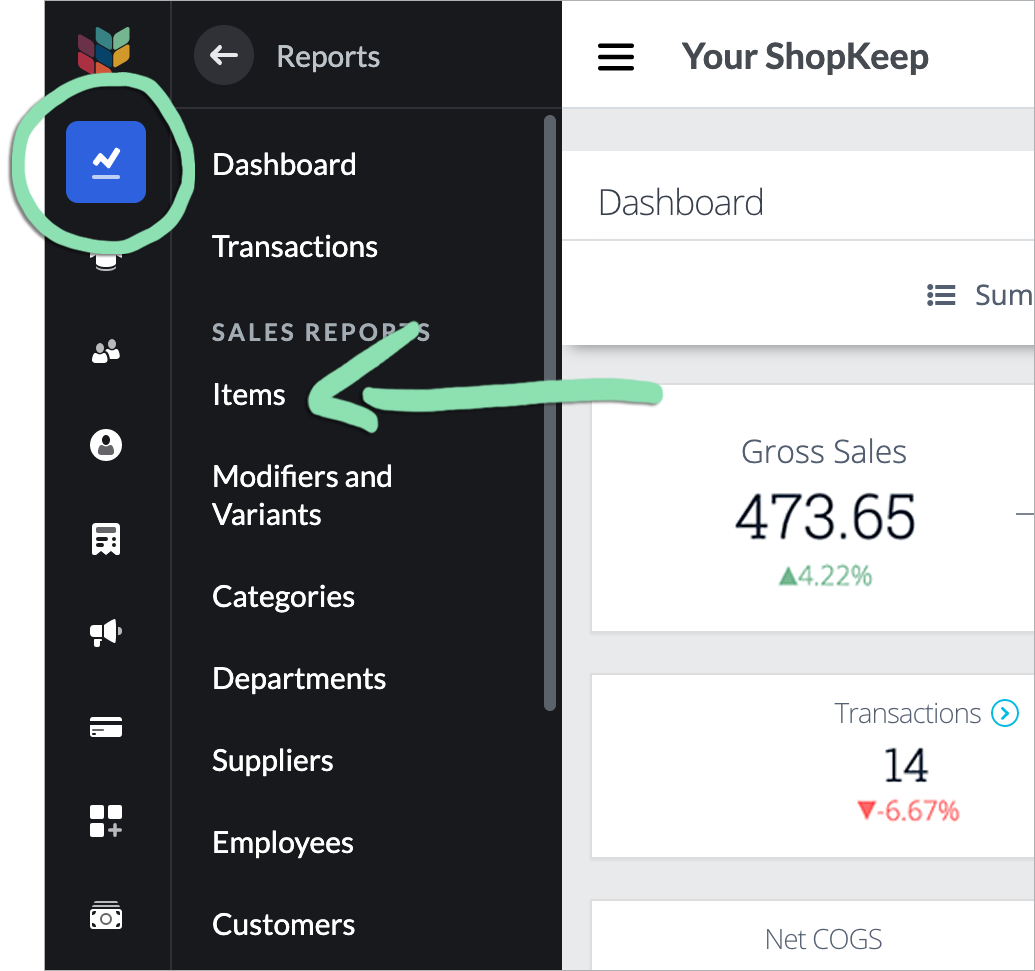
Click Reports and select Items.
-
(Optional) Click the Today dropdown to choose a different date or date range, then click Retrieve.
-
(Optional) Click the This location dropdown to select whether to run the report for the current location only or for all linked locations.
This setting is available to merchants with multiple linked locations and is only visible to the Business Owner. Visit the New Store Setup article to learn how to create a new linked location or the Multi-Store Management guide to learn how to link existing locations.
Reading the report
The Sales by Item report can show you which stock items are in demand and which are not. Learn to read this report to understand its data and discover new insights about your business.
Bar charts
Click Top Performing Items Chart to display the bar charts.
These charts show top items by Quantity Sold and Sales Amount as percentages for the selected date range.
Items appear with the names currently entered in BackOffice for them. Other refers to the combination of all items outside of the top 10.

You can hover over or tap on a bar to see the Sales Count and Percent of Total items sold for each item.
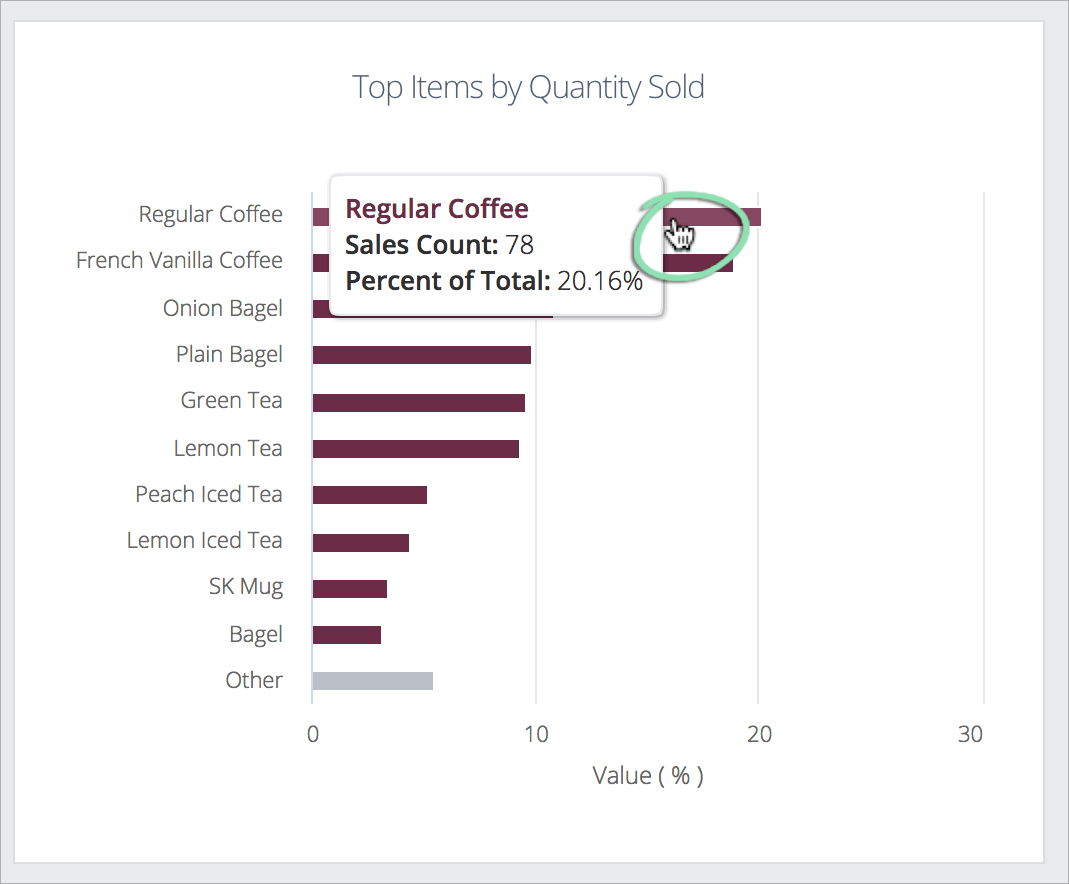
Table view
The table view provides detailed information about all items sold over the selected date range.
You can click and drag a column's name to reorder it. You can also resize and sort columns, as well as customize which columns are shown.
To customize the columns shown:
-
Click Add/Remove columns.
-
Check (show) or uncheck (hide) the boxes beside the columns you want to view.
- Click Update.
The default columns shown are:
-
Item: Name of the item as it is currently entered in BackOffice.
Shipping, delivery, and pickup charges for supported Lightspeed eCom (E) orders, as well as new sales run in Lightspeed Pocket and Lightspeed Pay, will appear in reporting as an item named Custom amount.
- Department: Name of the department the item is currently assigned to. See which departments generate the most sales using the Sales by Department report.
- Category: Name of the category the item is currently assigned to. See which categories generate the most sales using the Sales by Category report.
- Supplier: Name of the item's supplier.
- SKU: The item's SKU.
- Quantity on Hand: The total quantity of items in stock and available for sale.
- Quantity Sold: The total quantity of the item sold.
- Last Sold Date: The date the item was most recently sold.
-
Sales Amount: Total item sales amount before discounts, returns, gratuity, and tax.
Sales tax figures in reporting are estimates based on how you have configured your tax rates and tax groups in BackOffice. For official filings, always verify your current local rates, then manually calculate tax using net taxable and non-taxable revenues. Be aware that tax laws can change at any time, and you should contact a tax professional for specific tax advice regarding your business. To learn how tax is calculated in Retail POS (S-Series), visit the Sales by Tax Rate Report article.
- Costs: Cost of all sold items minus the cost of returned items. By default, Cost is calculated using the weighted average cost at the time of sale for each item.
- Discounts: Discounts on all sold items minus discounts on returns. Want to see more detail on discount usage? Check out the Sales by Discount report.
- Gross Margin: Percentage of Net Sales left after accounting for Costs.
- Gross Profit: Net Sales minus Costs.
- Net Sales: Sales Amount minus Returns Amount and minus Discounts.
To sort by a column:
-
Click any header with arrows.
-
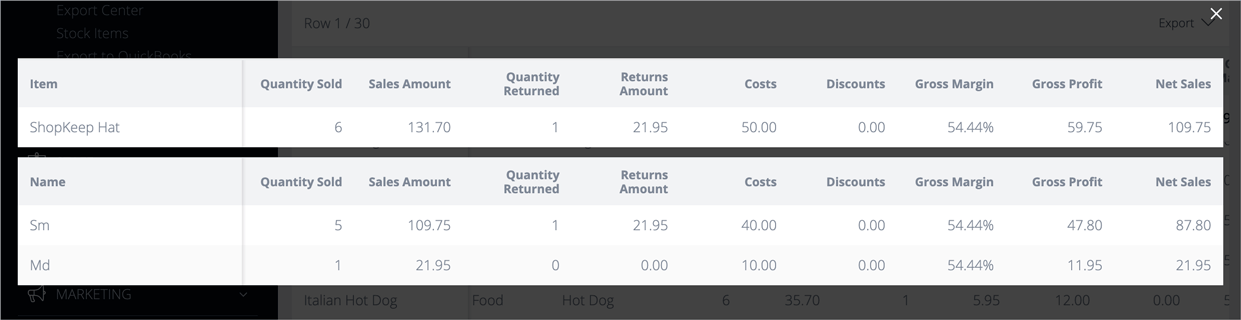
Click an underlined item to see the modifiers or variants sold for that item. Modifiers and variants appear with names as currently entered in BackOffice.

Example of an item with modifiers:

Example of an item with variants:
Looking for more detail on modifier and variant usage? Visit the Modifiers and Variants report.
Filtering the report
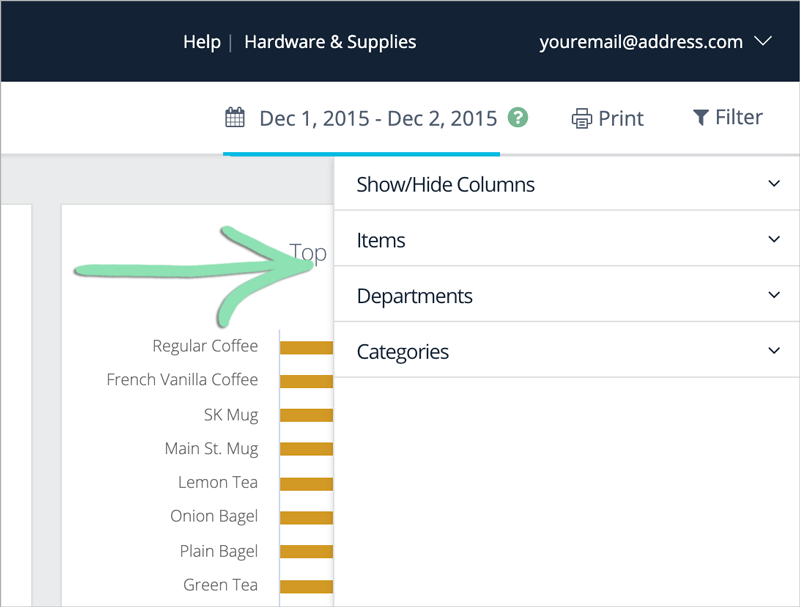
You can filter the report to customize which table columns are shown. Filter by item to hide or show individual items or all of the items in specific departments and categories.
-
Click Filter.
-
Select a filter option.
- Show/Hide Columns: Show or hide table columns.
- Items: Show or hide individual items.
- Departments: Show or hide all items in specific departments.
- Categories: Show or hide all items in specific categories.
- Supplier: Show or hide all items from a specific supplier.
Column filters apply to the Table View and Print View. Item, department, and category filters apply to the Bar Charts, Table View, Export, and Print View.
Exporting the report
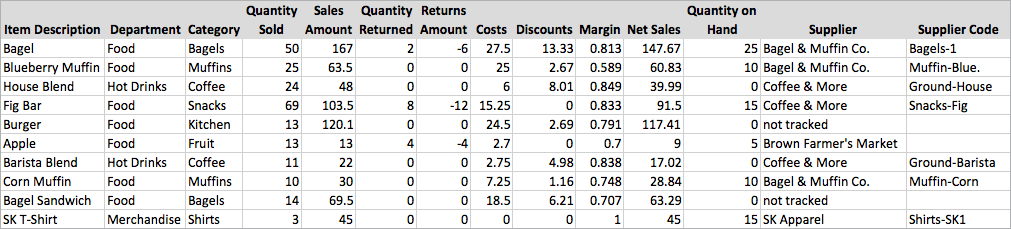
Download a copy of the Sales by Item report to analyze and filter its data using spreadsheet software.
-
On the Table View, click Export.
Select how you want the report to be exported.
- Item sales summary: Sales information for every item sold over the time period. See sample report.
-
Variants summary: Shows all sold items and displays details for individual variants. See sample report.
This export has Product Name and Line Item Name columns. For basic items, the item name is listed in both columns (i.e. Toaster: Toaster). For items with variants, the item name is listed in the first column and the variant name in the second (i.e. Pants: Large Blue)
- Modifiers summary: Breaks down modifier usage for items with modifiers. See sample report.
-
Customize breakdown: Further customize the breakdown of your export.
Select the Value:
- Quantity Sold
- Sales Amount
- Quantity Returned
- Returns Amount
Choose the Order by time:
- Month
- Weekday
- Hour
- Click Export and wait for the export to be generated. Check the box to be notified by email when exports are ready for download (optional).
-
Exports will automatically download. Exports that take more than a few seconds to generate are downloadable via the Export Center when ready. Click OK to close the message box.

After downloading, the export is ready to open in any spreadsheet software.
Printing the report
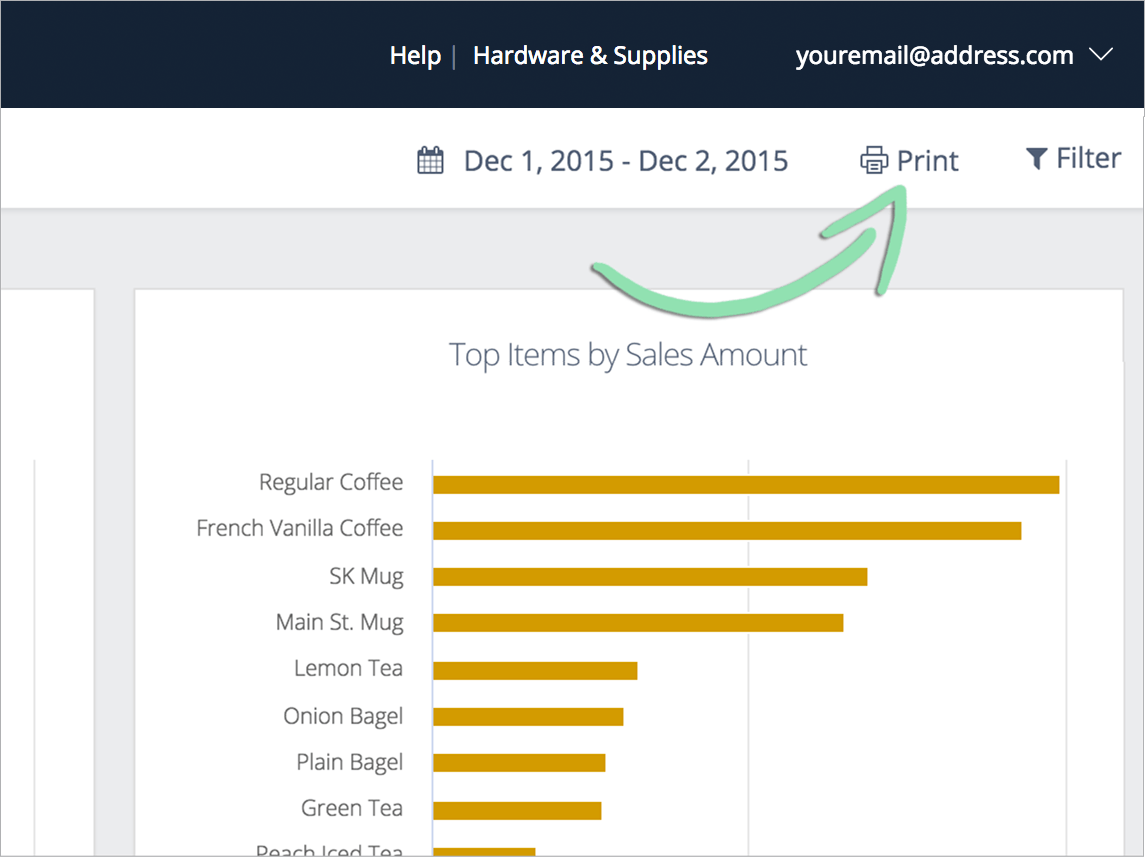
Use the print feature to generate the report in a printer-friendly format that can be printed or saved.
-
Click Print.
-
Wait for the report to open in a new browser tab.

-
Click File on the web browser’s menu and select Print, or choose to save the print view as a PDF.

Have questions about BackOffice reporting? Visit Reporting FAQ.